Artificial Intelligence, Fuzzy Logic, and Stock Exchange Trading
Posted: January 28th, 2016 | Author: Domingo | Filed under: Artificial Intelligence | Tags: Adaptive neuro-fuzzy inference systems, ANFISs, ANN, artificial intelligence, FISs, Fuzzy inference systems, Fuzzy Logic, High Frequency Trading algorithms, Intelligence Trading System, Moving Average Convergence/Divergence, Neural network architectures, Neurofuzzy System, Relative Strength Index, Stock Quantity Selection Component | 2 Comentarios »Some of you might be familiar with the term high-frequency trading (HFT). As Daniel Lacalle explained in his book Life in the Financial Markets, HFT is a type of trading in which millions of operations are performed through algorithms in milliseconds. Nowadays around 30% of the stock exchange transactions are carried out by the high-frequency trading (HFT) algorithms.
Following the line exposed by Lacalle in this book, in this post I’m going to write about two distinct approaches to stock exchange trading based on artificial intelligence; namely, the Intelligence Trading System and the Stock Quantity Selection Component.
The Intelligence Trading System -developed by the researchers R. Monruthai, W. Hataitep, and M.L. Kulthon Kasemsan, introduces an intelligent decision-making model -not a forecasting one, based on the application of fuzzy logic and neurofuzzy system (NFs) technology; it captures knowledge from experts who are making decisions to buy, hold, or sell from technical analysis, as well as input from the suggested trading systems based on NFs. The objective of this approach is to analyze the stock daily and to make one day forward decisions related to the purchase of stocks.
In this system technical analysis procedures are used for the decision strategy recommendation. The recommendations (R) represent the relative rank of investment attraction to each stock in the interval [−1, 1]. The values −1, 0, and 1 represent recommendations: Sell, Hold and Buy, respectively. After that, the recommendations are included in the input of the proposed intelligence system. The intelligence system output is the evaluating recommendation based on several decided courses of action from various techniques used by investors as shown in the figure 1 below:
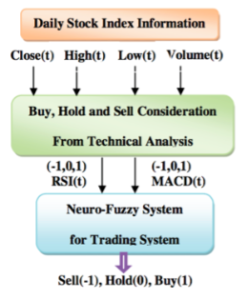
Fig. 1 Intelligence Trading System Process
Technical analysts usually use indicators to predict future buy and sell signals, such as (MACD), Relative Strength Index (RSI), or Exponential Moving Average (EMA). Each indicator is included in the input signal for the intelligence system. E.g., MACD is a popular and simple indicator for trends. Stochastic and RSI are some simple indicators which help traders identify turning points.
The second approach -the Stock Quantity Selection Component developed by the researchers B.P. Pretesh B. P. and M. Tshilidzi, employs pattern classification methods using artificial neural networks (ANNs), fuzzy inference systems (FISs) as well as adaptive neuro-fuzzy inference systems (ANFISs). Based on the forecasted performance of certain indices, the Stock Quantity Selection Component recommends the investor to purchase stocks, hold the current investment position, or sell stocks in possession. Its approach focuses on a pattern classification problem utilized within an application, that could assist individual as well as institutional investors in making trading decisions.
The Stock Quantity Selection Component is based on the trading strategy ”Buy low, sell high”, with the percentage threshold combination of 0.8% and -0.20% of the closing value for the previous day, since it is the most profitable.
Three classifier designs of the SQSC are used to test the model:
- First design: it has 1 classifier with 16 inputs and 16 outputs. The model inputs: the forecasted performance of the closing price of the indices. The classifier outputs: investment recommendations for the indices.
- Second design: it has 4 classifiers, and each classifier has 4 inputs and 4 outputs. Each classifier is used to generate an investment recommendation for an index. The classifier input: the forecasted performance of the closing price of an index. The classifier output: the investment recommendation for the index.
- Third design: it has 16 classifiers, each classifier has 4 inputs and 1 output. Each classifier is used to categorize whether or not to execute an investment. The classifier input: the same as design 2. The classifier outputs are fed into an interpretation function that generates the final investment recommendations for indices.
The data utilized in developing and testing the various classifiers are divided into: training data set, used to train the ANN to find the general pattern between its inputs and outputs; validation data set, used to assess the network; and test data set: employed to confirm the classification quality of the developed model.
The accuracy of the designs is gauged through a matrix to identify the number of true and false classifications that are generated by the models developed:
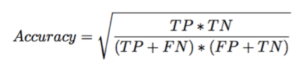
Fig 2. Accuracy Matrix
where:
TP is the true positive (1 classified as a 1); TN is the true negative (0 classified as a 0); FN is the false negative (1 classified as a 0); FP is the false positive (0 classified as a 1).
From the three designs afore-mentioned the most adequate is number 2 since it has low complexity, high scalability, and it is not required to re-create the existing classifiers, when additional recommendations are added.
Both models are a remarkable progress in the stock exchange trading scenario: on the one hand, the Intelligence Trading System means a one-step forward decision, achieving more stable results and higher profits when compared with NNs and Buy and Hold strategy. On the other hand the Stock Quantity Selection Component implies the development of acceptable classifier architectures to guide traders in their investments.
Nonetheless, an important drawback: from my standpoint both models fails in the sense of considering the trading activity as a game-theory exercise, when actually it is more a goal programming activity in which the information asymmetry, the limits of our knowledge, and such an important factor as fear, can play an extremely meaningful and definite role.
I believe the models may fail to represent the dimension of hormones excess in periods of prolonged bullish or bear markets. In the former, testosterone excess may blind market operators from inherent risks (excessive risk taking). In he latter, excess of cortisol representing pessimism and extreme risk aversion, may produce a more protracted market correction. The findings are included in the book “The biology of risk taking” from John Coates.
Another aspect to consider is that the level of the social psychology in market behaviour is at all times high, due to the financial repression caused by the zero rates policy implemented by all major central banks in the developed world. This is causing significant flows from bank deposits to market related instruments with daily mark to market through the investments NAV, further exacerbating the markets volatility.
Thanks a lot, Enrique, for your remark! You’re totally right regarding the huge weight of non-parametrical factors such as fears, psychological biases, alien macroeconomic trends… In any case, AI may be an excellent support and “colleague” for traders in their daily activities.